South Santa Barbara County Real Estate: September 2026 Year-to-Date Review
Nov 2, 2026
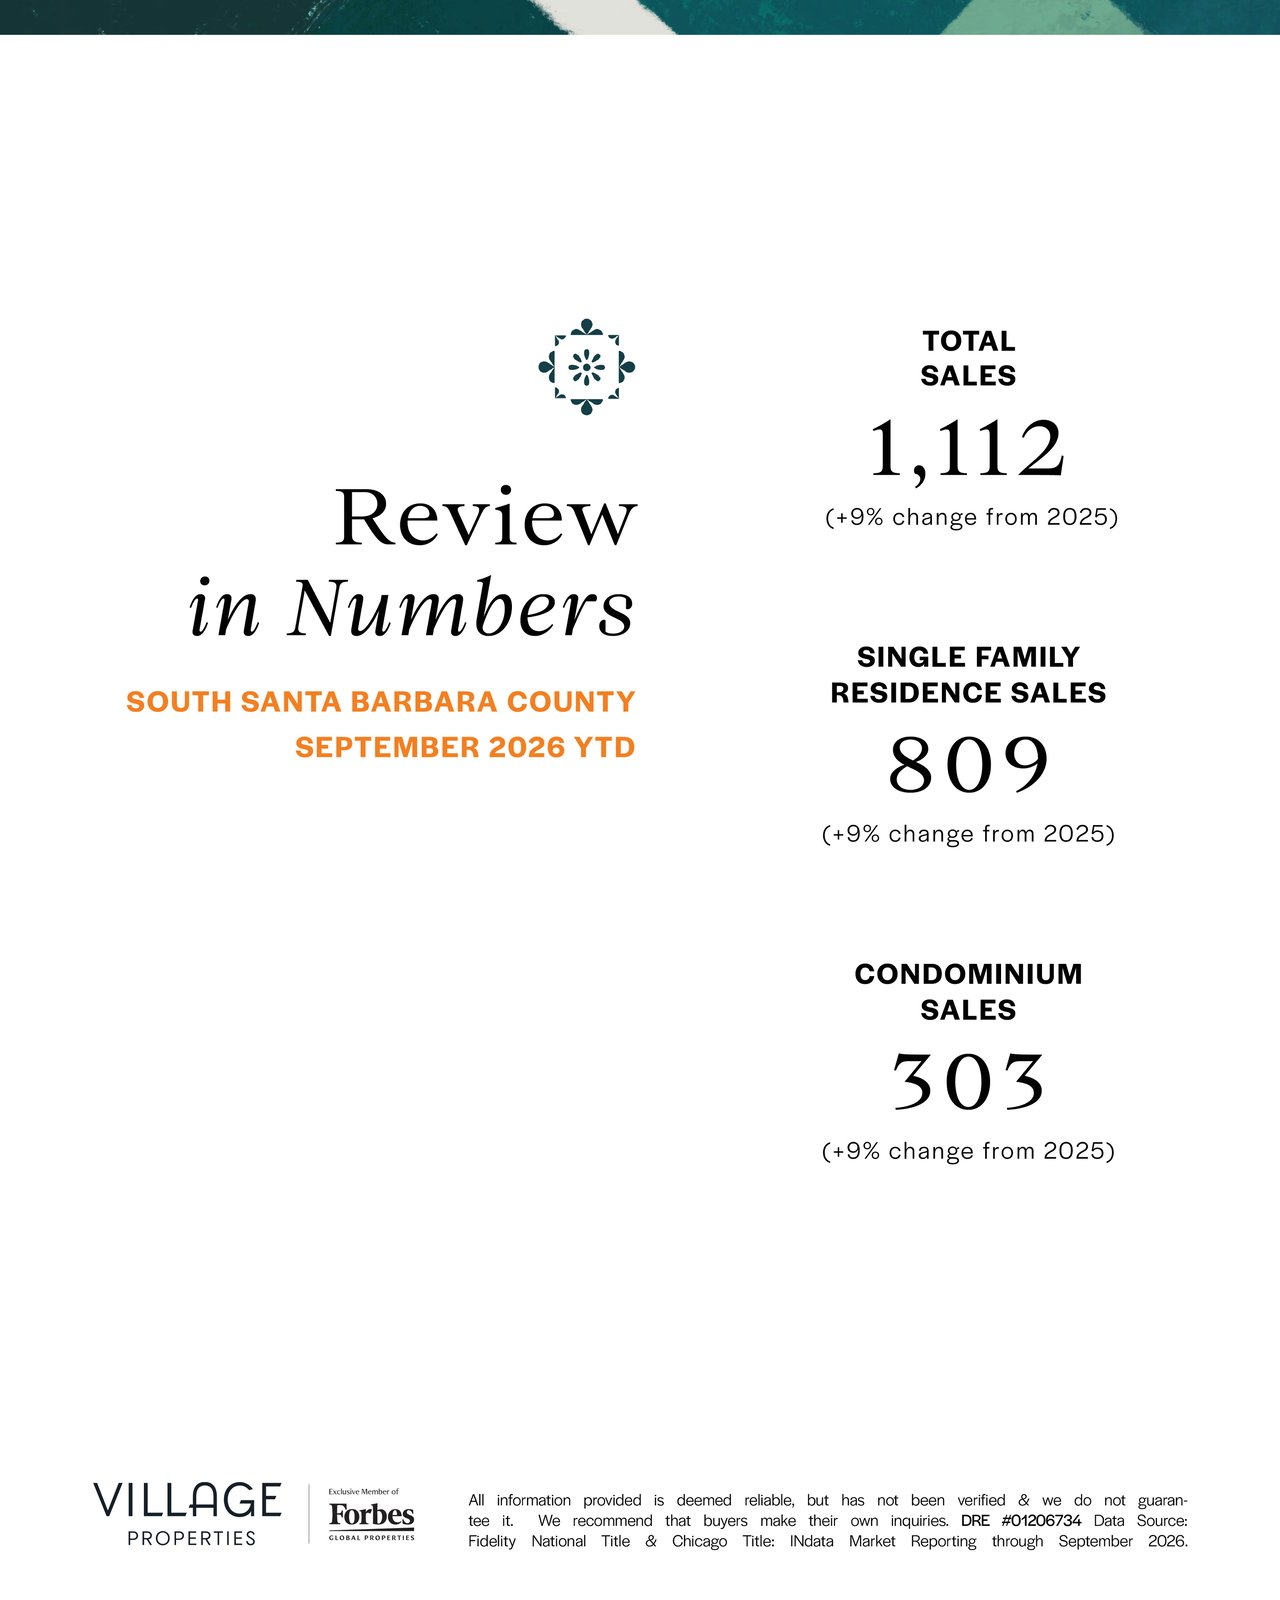
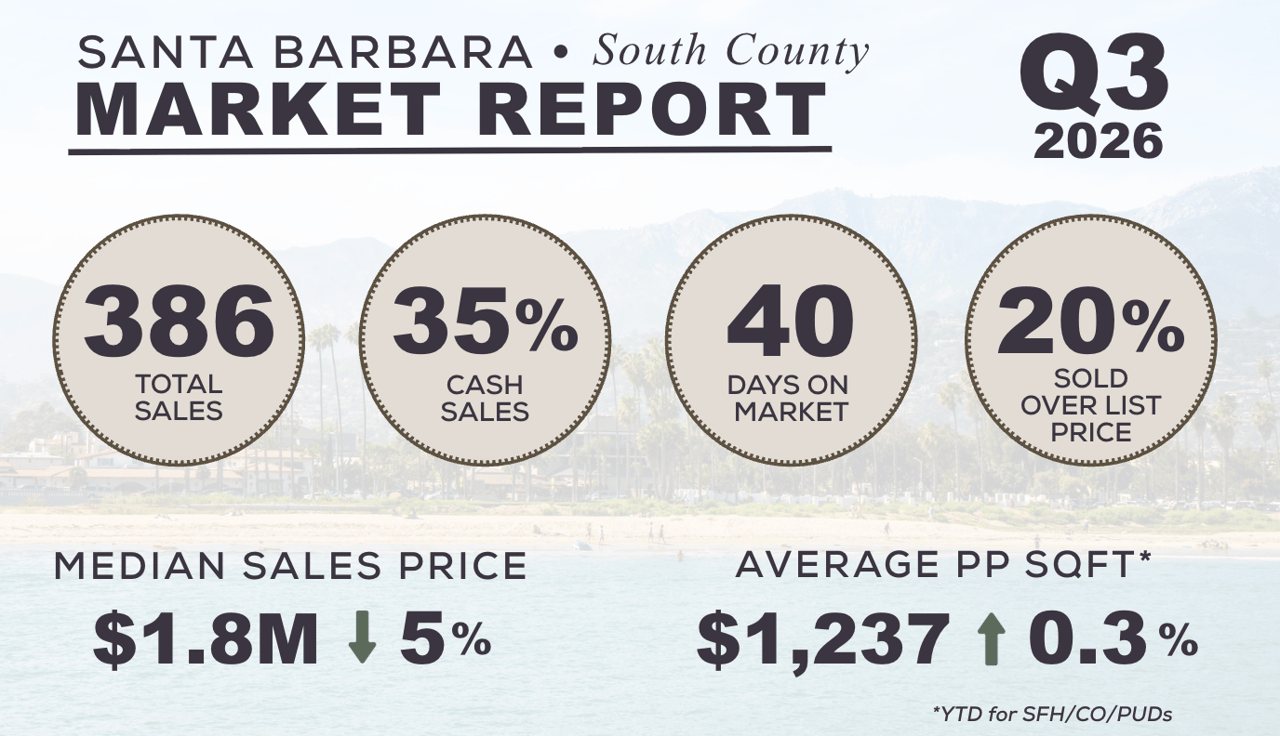
More homes are changing hands on the South Coast this year, and buyers are paying a little less for them. Through September, 1,112 homes sold across South Santa Barbara County, up 9% from the same point in 2025, while median prices eased for both single-family homes and condos.
More activity at gentler prices is a shift worth a closer look. Here's what the year-to-date numbers show, and what they mean if you're thinking about buying or selling.
The Big Picture: Sales Up, Prices Softer
Sales rose 9% across the board, with single-family homes and condos climbing at the same pace.
Property type | Sales YTD | vs. 2025 | Average price | vs. 2025 | Median price | vs. 2025 |
|---|---|---|---|---|---|---|
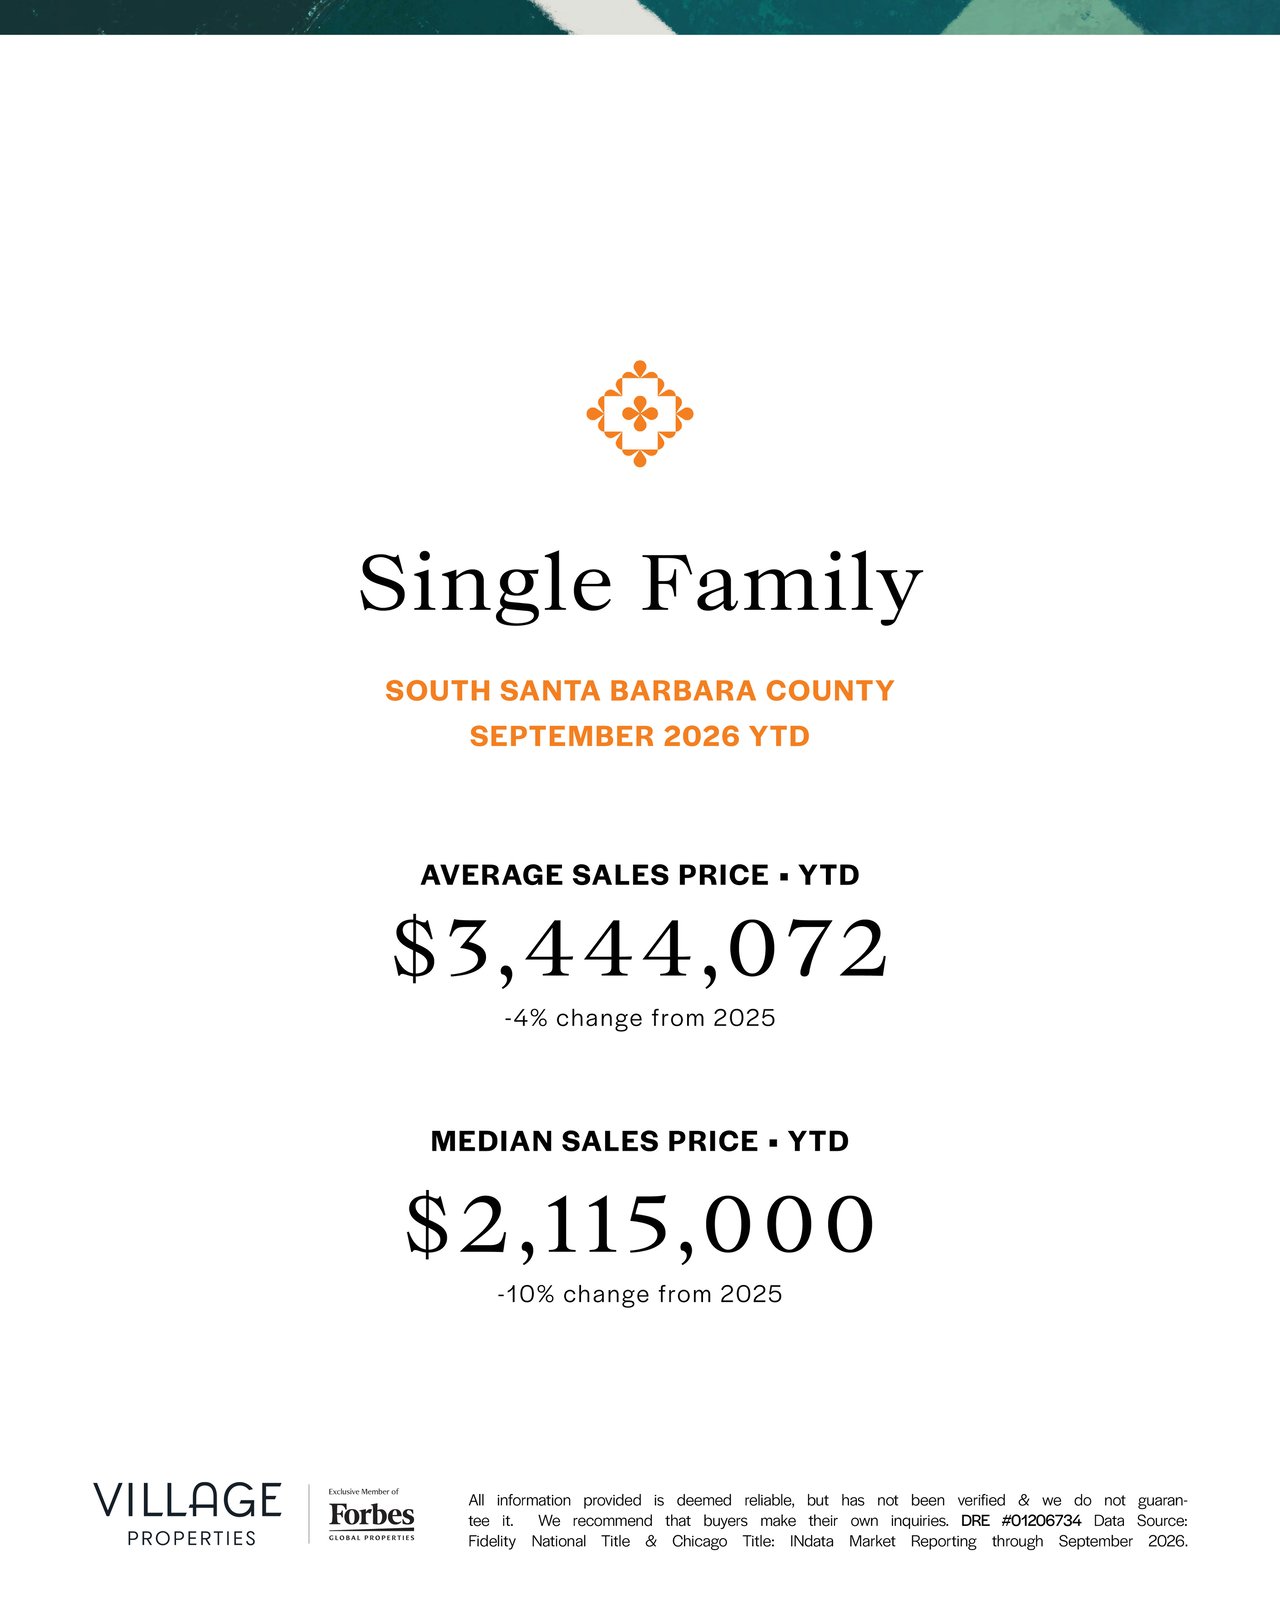
Single-family homes | 809 | +9% | $3,444,072 | -4% | $2,115,000 | -10% |
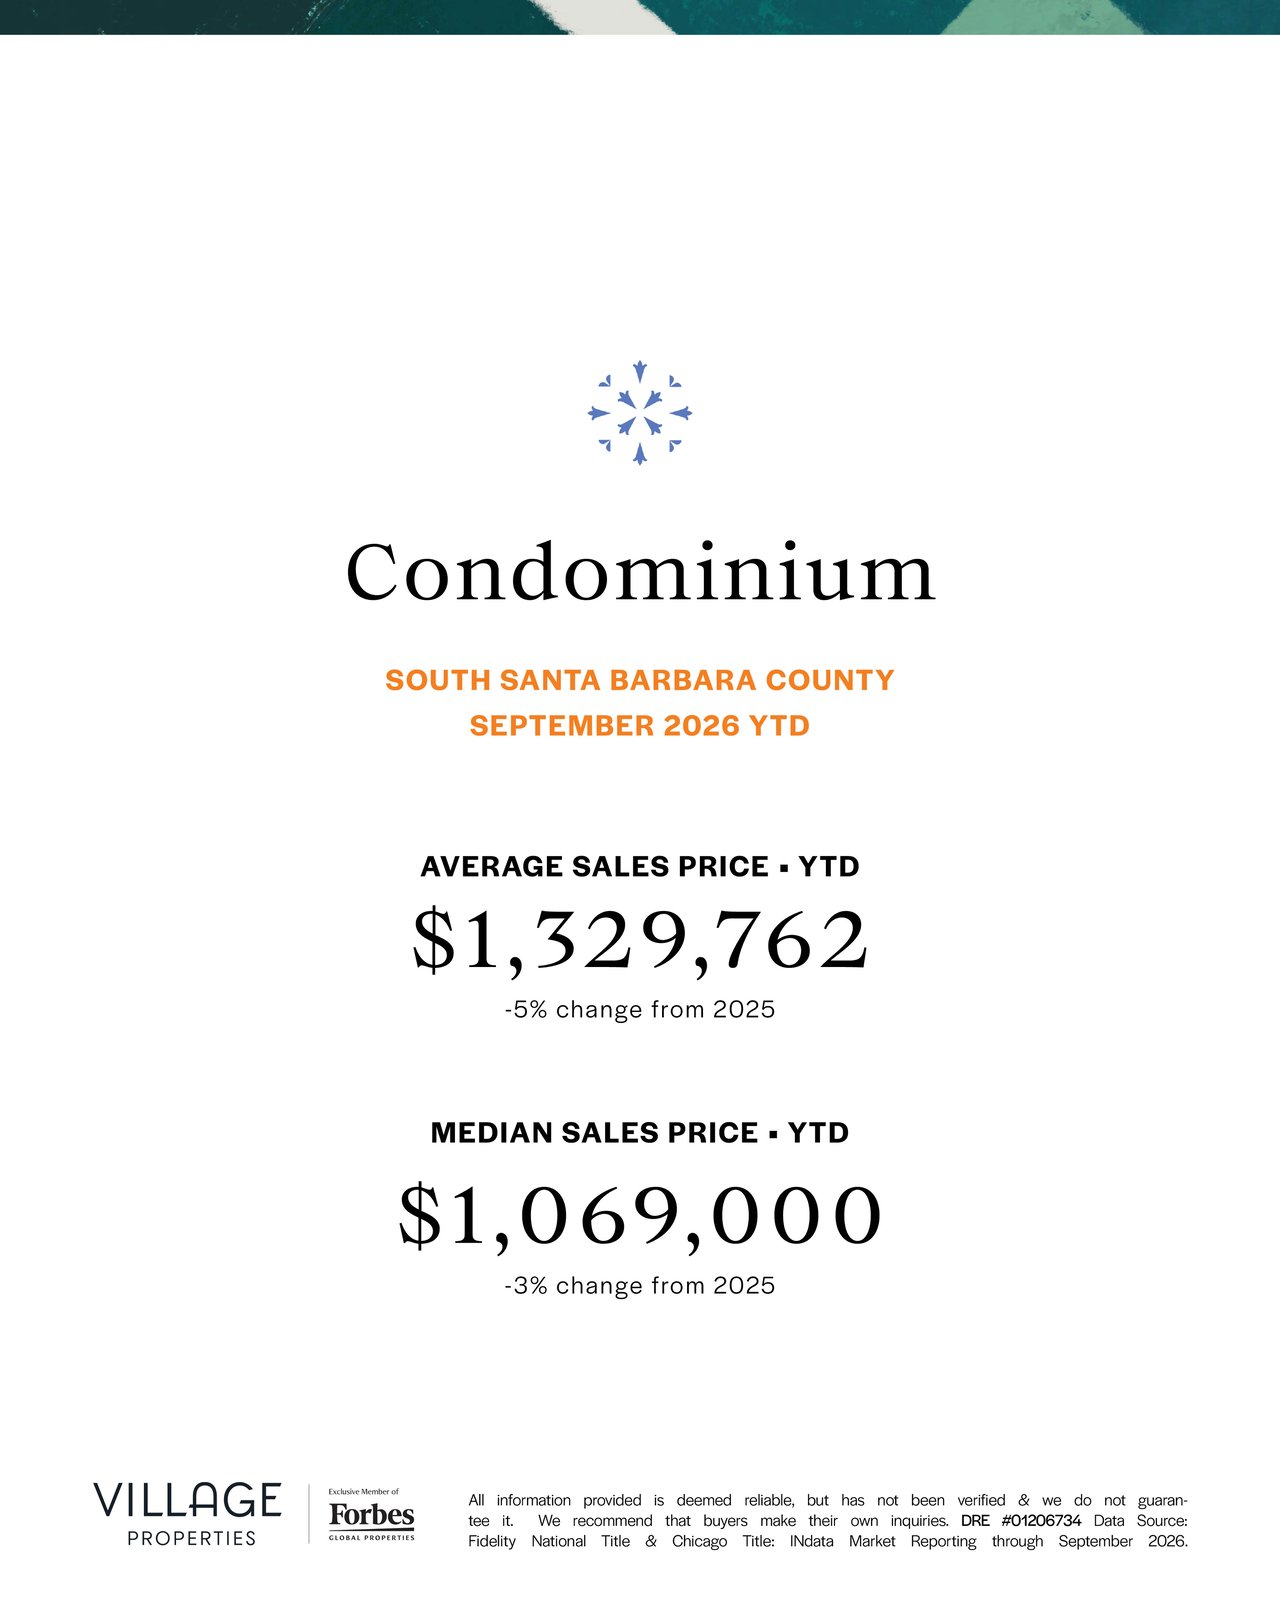
Condominiums | 303 | +9% | $1,329,762 | -5% | $1,069,000 | -3% |
All homes | 1,112 | +9% |
The 10% drop in the single-family median stands out. Part of it likely reflects which homes are selling: more sales at the entry and middle of the market pull the median down, even when individual home values hold steady. Condo prices moved less, with the median off just 3%.
Neighborhood by Neighborhood
Prices on the South Coast span a wide range, from a $1.64 million median single-family home in Goleta to more than $7 million in Hope Ranch.
Single-family homes, year to date
Area | Sales | Average price | Median price |
|---|---|---|---|
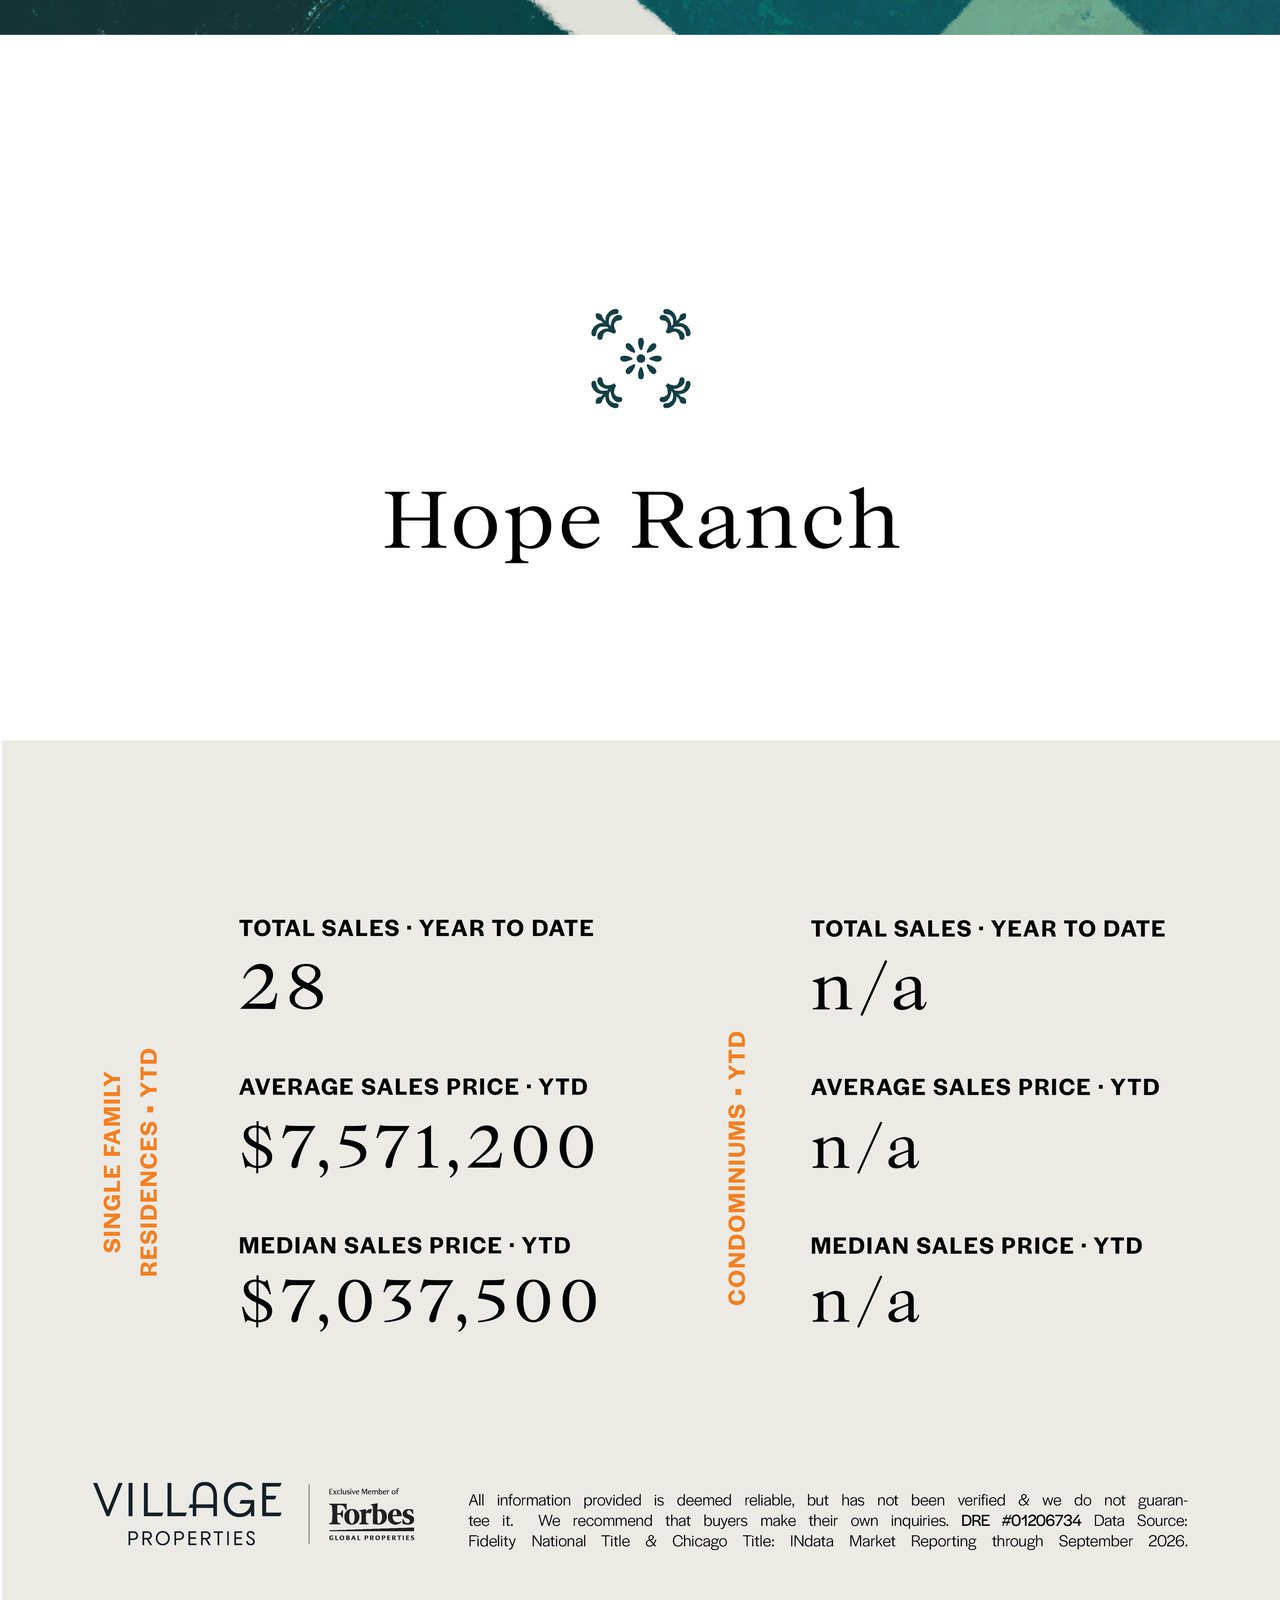
Hope Ranch | 28 | $7,571,200 | $7,037,500 |
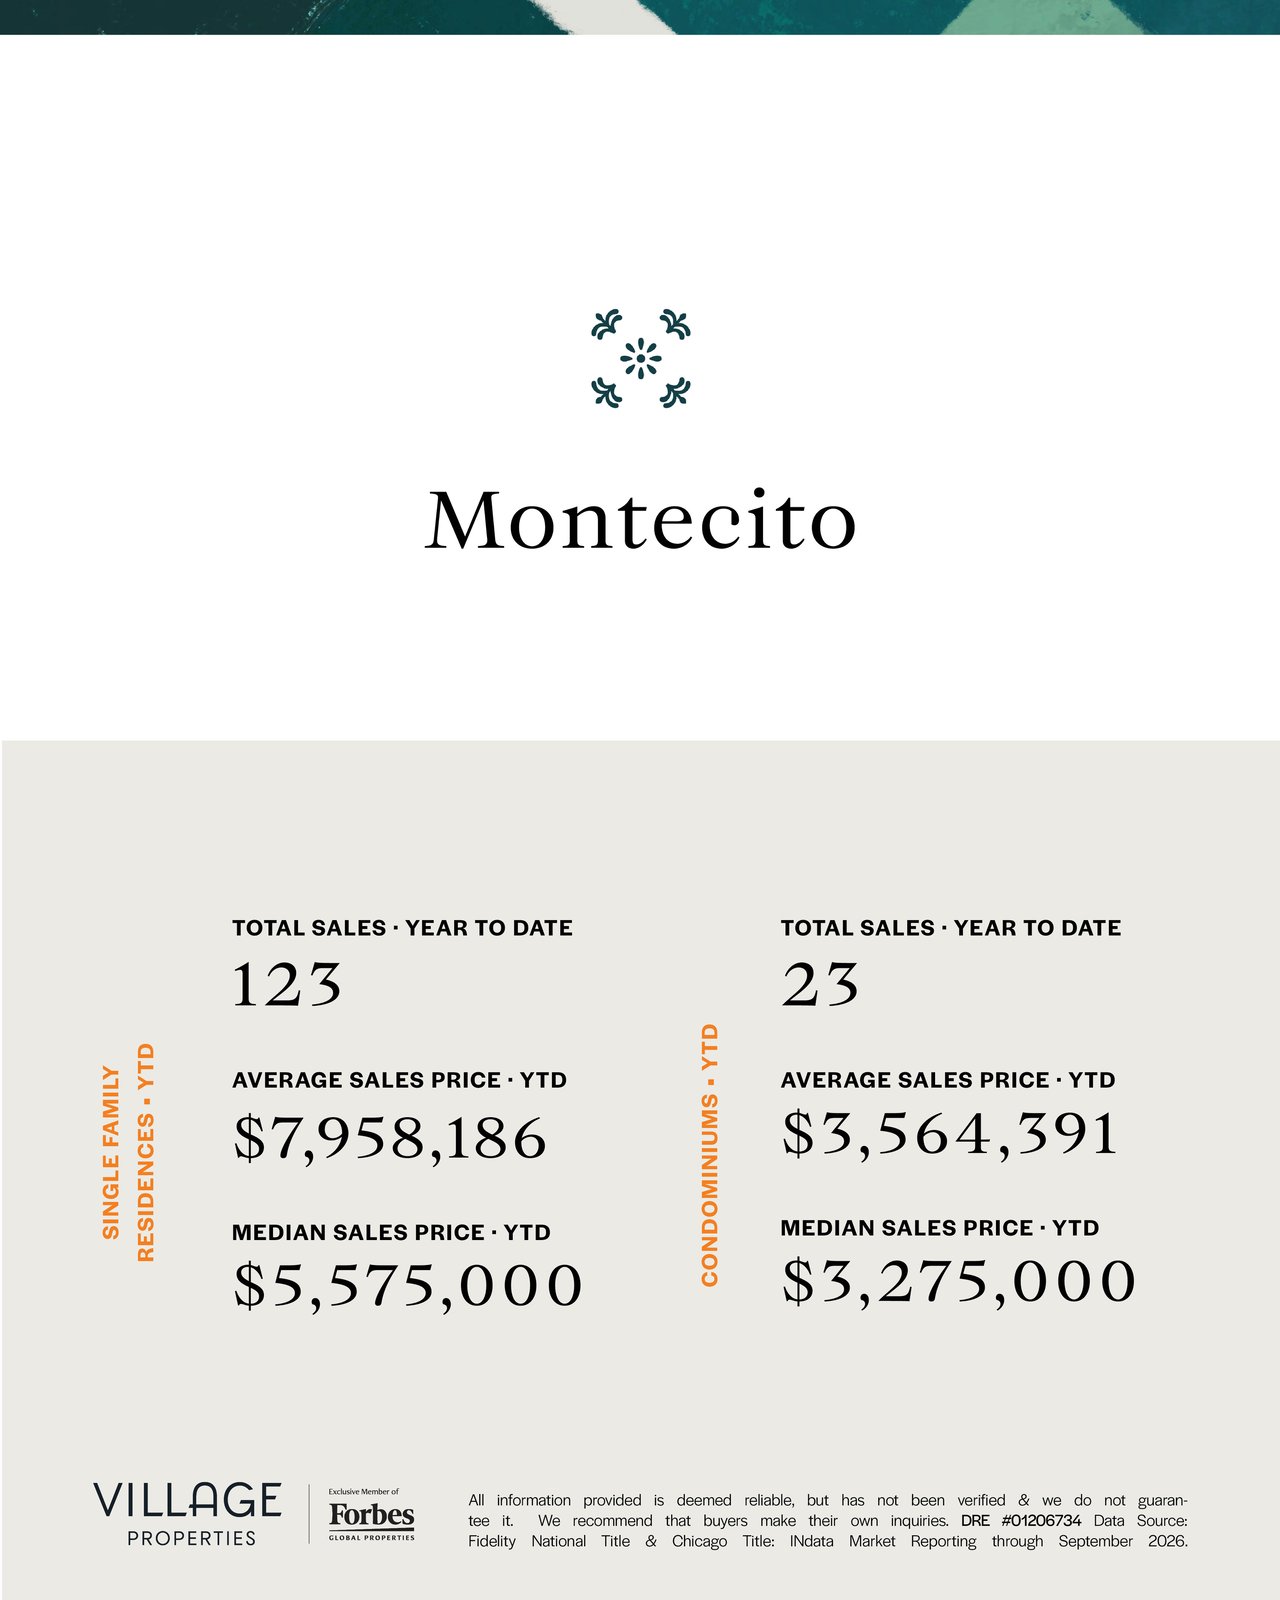
Montecito | 123 | $7,958,186 | $5,575,000 |
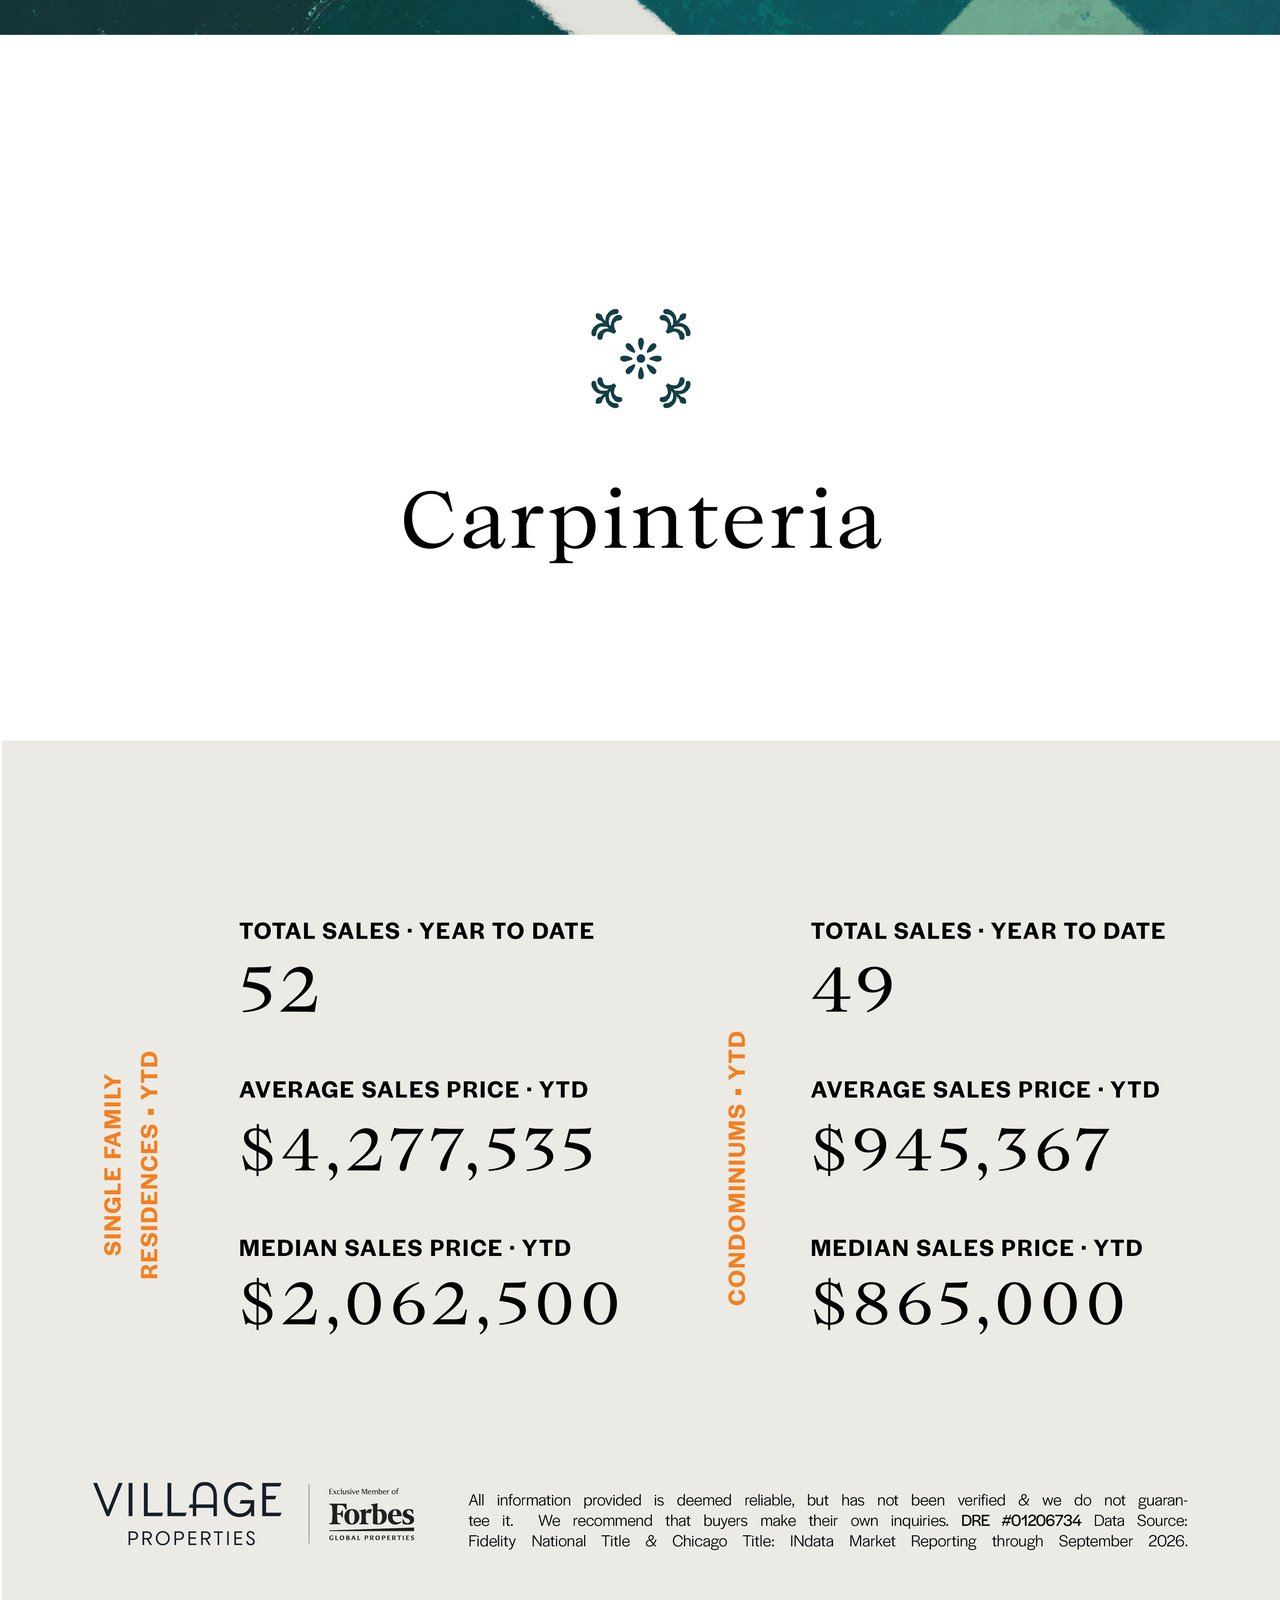
Carpinteria | 52 | $4,277,535 | $2,062,500 |
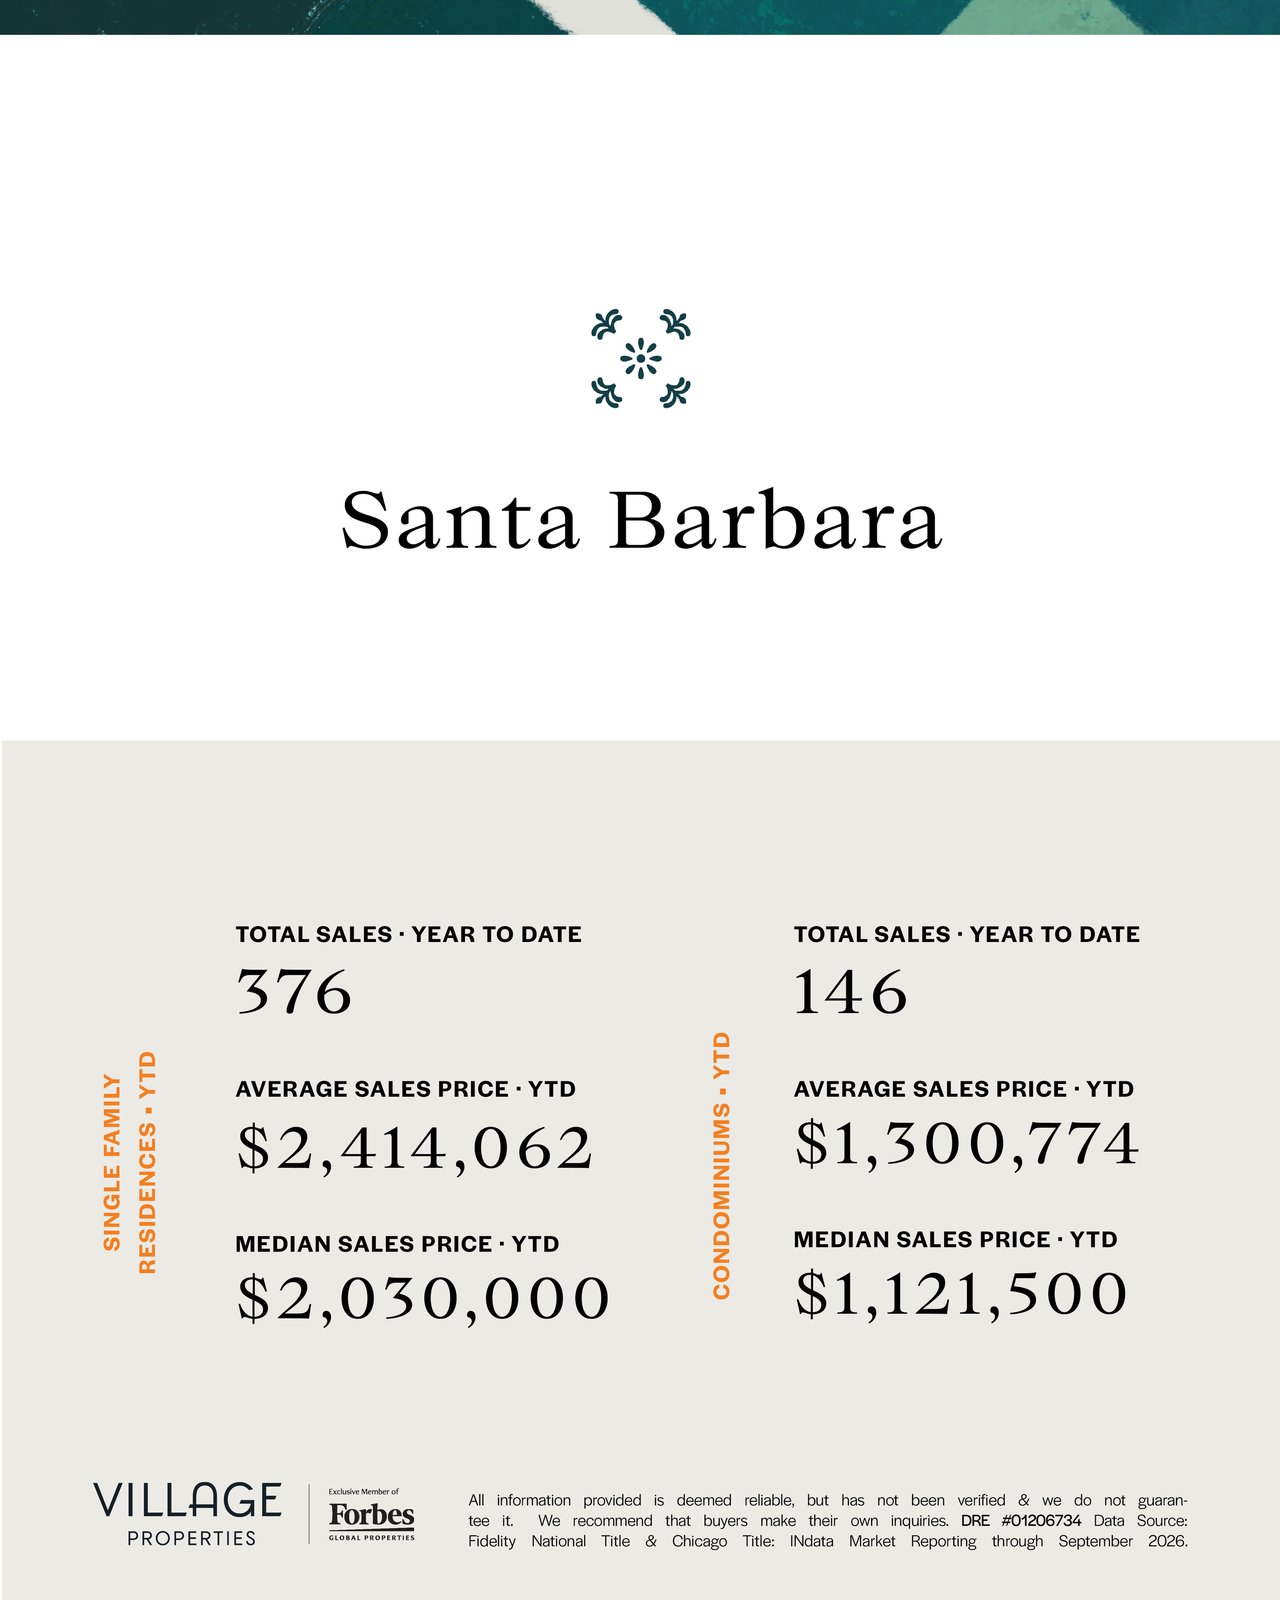
Santa Barbara | 376 | $2,414,062 | $2,030,000 |
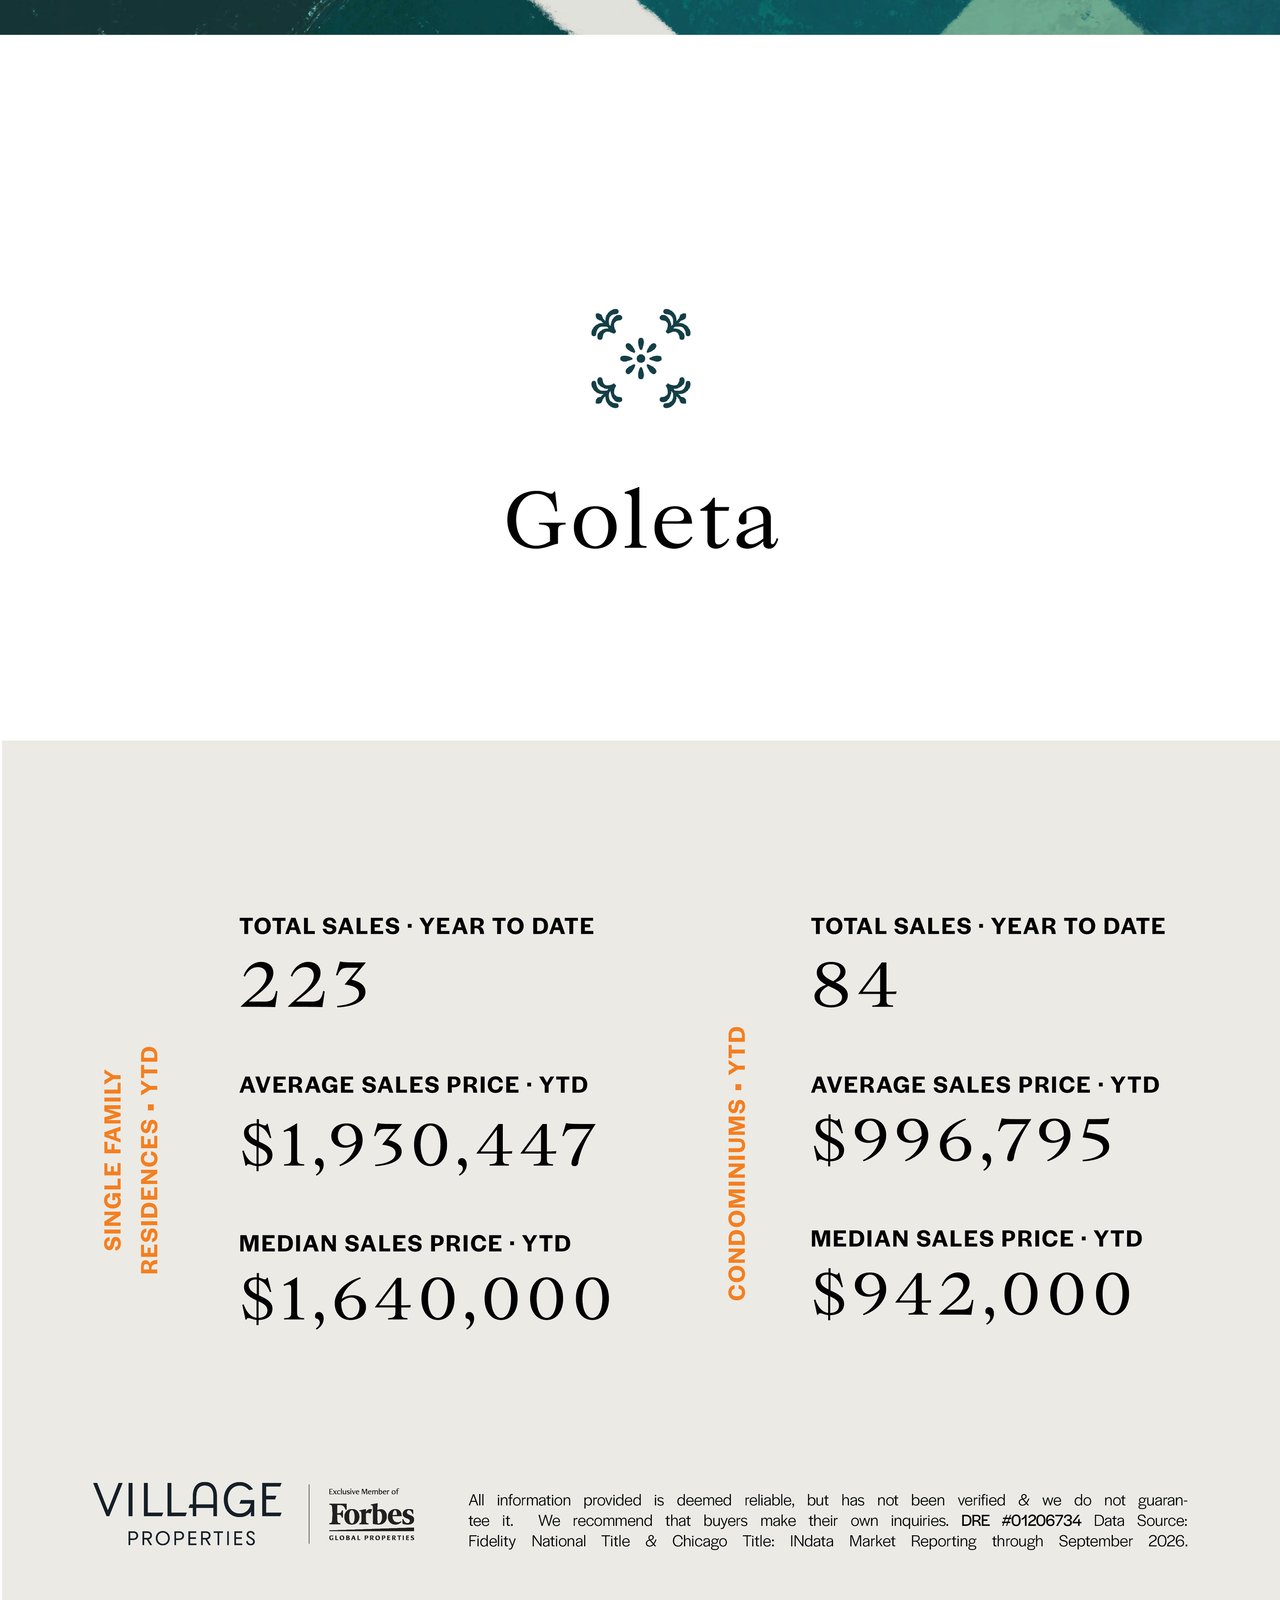
Goleta | 223 | $1,930,447 | $1,640,000 |
Condominiums, year to date
Area | Sales | Average price | Median price |
|---|---|---|---|
Montecito | 23 | $3,564,391 | $3,275,000 |
Santa Barbara | 146 | $1,300,774 | $1,121,500 |
Goleta | 84 | $996,795 | $942,000 |
Carpinteria | 49 | $945,367 | $865,000 |
Hope Ranch recorded no condo sales this year.
Santa Barbara is the engine of the market. Its 376 single-family sales make up nearly half of all house sales in the region, at a median of $2.03 million.
Montecito posted the highest average single-family price at $7.96 million. Its condos are in a class of their own too, with a $3.28 million median, roughly triple the countywide condo median.
Hope Ranch had the highest median of any area at $7.04 million, across 28 sales.
Goleta remains the most accessible place to buy a house on the South Coast, with a $1.64 million median. With 223 sales, it was also the second-busiest market.
Carpinteria shows how a few big sales can skew the picture. Its average single-family price of $4.28 million is more than double its $2.06 million median. Carpinteria also offers the lowest condo median in the region, at $865,000.
What It Means for You
For buyers: Softer prices and more transactions mean more room to negotiate than you may have had in recent years. If a South Coast home has felt out of reach, it's worth taking a fresh look, especially in Goleta, Santa Barbara and the Carpinteria condo market.
For sellers: Buyers are clearly active, with sales up 9% in every category. But they're also price-conscious. Homes that are prepared well and priced with today's numbers in mind are the ones that sell, rather than sitting while the market moves past them.
For everyone: Countywide averages only tell part of the story. Prices vary widely by neighborhood, and even by street, so local data matters more than headlines.
Let's Talk About Your Home
Wondering what these numbers mean for your home or your search? The Crawford Speier Group is happy to walk you through recent sales in your neighborhood and help you plan your next move. Reach out anytime.
Data source: Fidelity National Title & Chicago Title, INdata Market Reporting, year to date through September 2026. All information is deemed reliable but not guaranteed.